LiDAR-Based Forest Inventory: Methods and Implementation
2025/09/15
LiDAR-Based Forest Inventory: Methods and Implementation
Airborne LiDAR (Light Detection and Ranging) technology has transformed forest inventory methodology over the past two decades. By providing detailed three-dimensional structural information on forest canopies, LiDAR enables more accurate and cost-effective biomass estimation compared to traditional ground sampling alone, particularly for large-area assessments.
LiDAR Technology Fundamentals
Data Acquisition
Airborne laser scanning systems:
- Laser pulse emission: Near-infrared wavelengths (typically 1064 nm or 1550 nm)
- Return detection: Multiple returns from canopy layers and ground surface
- Position determination: Integration with GPS/IMU for precise georeferencing
- Point density: 1-20 points per square meter depending on flying height and scan angle
- Coverage: 500-2000 meters swath width with 20-50% overlap between flight lines
Point Cloud Characteristics
Raw LiDAR data provides:
- X, Y, Z coordinates: Three-dimensional position for each laser return
- Intensity: Return signal strength indicating surface reflectance
- Return number: First, intermediate, or last return from pulse
- Classification: Automated or manual assignment to ground, vegetation, buildings
- Timestamp: Enables trajectory reconstruction and quality control
Data Processing Workflow
Standard processing sequence:
- Trajectory resolution: GPS/IMU integration for sensor position/orientation
- Point cloud generation: Conversion of raw waveforms to 3D coordinates
- Quality control: Overlap analysis, vertical accuracy assessment
- Ground classification: Automated algorithms (e.g., progressive TIN densification)
- Normalization: Height above ground calculation for vegetation returns
- Derivative products: Canopy height models, intensity images, metrics
Forest Measurement Approaches
Area-Based Methods
Statistical correlation between LiDAR metrics and field plots:
Methodology:
- Establish field sample plots with conventional measurements (diameter, height, species)
- Extract LiDAR-derived metrics for plot areas (height percentiles, density, intensity)
- Develop regression models predicting forest attributes from LiDAR metrics
- Apply models wall-to-wall across study area using LiDAR coverage
Advantages:
- Statistically robust with proper field sampling design
- Handles complex forest structures (mixed species, multi-layered canopies)
- Provides uncertainty quantification through prediction intervals
- Compatible with existing forest inventory frameworks
Metrics commonly used:
- Height percentiles (95th, 90th, 75th, 50th, 25th)
- Canopy density metrics (percentage first returns above thresholds)
- Canopy cover (percentage ground returns)
- Statistical moments (mean, standard deviation, skewness, kurtosis)
- Intensity statistics (mean, percentiles of return intensity)
Individual Tree Detection
Explicit identification and measurement of individual trees:
Algorithms:
- Local maxima identification: Height-based crown peak detection
- Watershed segmentation: Delineation of crown boundaries
- RANSAC-based methods: Robust detection under occlusion and overlap
- Machine learning: Neural networks for complex crown shapes
Measurements extracted:
- Tree location (X, Y coordinates)
- Tree height (crown peak to ground)
- Crown diameter (horizontal extent of delineated crown)
- Crown volume (3D characterization from point cloud)
Species classification:
- Intensity patterns (reflectance differences among species)
- Geometric features (crown shape, branch architecture)
- Multispectral LiDAR (species-specific spectral signatures)
- Integration with optical imagery (color, texture, phenology)
Advantages:
- Direct tree measurements compatible with growth models
- Enables tree-level management prescriptions
- Provides spatial pattern information (clustering, gaps)
- Supports biodiversity assessment through structural diversity
Limitations:
- Accuracy decreases in dense forests with crown overlap
- Understory trees often missed due to canopy occlusion
- Computationally intensive for large areas
- Requires validation with high-quality field data
Biomass Estimation Methods
Direct Allometry
Tree-level biomass from detected individuals:
Approach:
- Individual tree detection provides height and crown diameter
- Apply allometric equations relating dimensions to biomass
- Sum tree-level estimates within management units
- Aggregate to stand or landscape scales
Allometric models:
- Species-specific equations preferred (diameter-height-biomass)
- Regional equations when species unavailable
- Crown volume relationships for LiDAR-specific applications
- Component models (stem, branch, foliage) for detailed accounting
Uncertainty sources:
- Detection errors (omission and commission)
- Measurement errors (height, crown dimensions)
- Allometric model uncertainty
- Species misclassification
Area-Based Regression
Statistical modeling approach:
Model development:
- Field plots provide reference biomass from conventional measurement
- Extract LiDAR metrics for plot areas
- Develop regression models (linear, nonlinear, machine learning)
- Validate with independent test data
- Apply across entire LiDAR coverage
Model forms:
- Multiple linear regression with metric selection
- Nonlinear models (power functions, exponential)
- Random forest regression (ensemble methods)
- Neural networks for complex relationships
Validation metrics:
- R² (coefficient of determination)
- RMSE (root mean square error)
- Bias (systematic over/under-estimation)
- Relative RMSE (percentage error)
Implementation Considerations
Flight Planning
Acquisition specifications:
- Pulse density: Minimum 4-8 points/m² for forest inventory
- Flying height: Balance between productivity and point density
- Scan angle: Limit to ±15° from nadir for vertical accuracy
- Timing: Leaf-on for deciduous, consistent phenology across area
- Weather: Avoid rain, fog, high winds affecting aircraft stability
Ground Reference Data
Field sampling design:
- Plot size: 0.04-0.1 hectares for area-based methods
- Plot shape: Circular plots for easier LiDAR metric extraction
- Sample intensity: 0.5-2% of area depending on heterogeneity
- Stratification: Sample across forest types, ages, densities
- Timing: Synchronize with LiDAR acquisition (within 1 year)
Measurements:
- All trees above threshold (typically 10 cm diameter)
- Diameter at breast height (DBH)
- Total height (subsample for height-diameter models)
- Species identification
- Live/dead status
- Crown class (dominant, codominant, intermediate, suppressed)
Quality Assurance
Verification procedures:
- Vertical accuracy: Check against RTK-GPS ground surveys
- Alignment: Verify overlap areas for consistency
- Completeness: Ensure no data gaps or low-density areas
- Classification: Validate ground/vegetation separation
- Outliers: Identify and investigate anomalous values
Cost-Benefit Analysis
Economic considerations:
- LiDAR acquisition: $20-100 per acre depending on area, density, terrain
- Field sampling: $500-2000 per plot for complete measurement
- Data processing: $10-30 per acre for standard products
- Model development: Fixed cost, amortized across large areas
Break-even analysis:
- Small areas (<1000 acres): Conventional inventory often more cost-effective
- Medium areas (1000-10,000 acres): LiDAR competitive with reduced field sampling
- Large areas (>10,000 acres): LiDAR significantly reduces cost per acre
- Repeat measurements: LiDAR advantage increases with monitoring frequency
Application Examples
California Compliance Carbon Offsets
Implementation on 180,000-acre timberland property:
- Area-based approach with 200 field plots
- Models developed for mixed conifer and hardwood forest types
- Achieved <10% RMSE meeting protocol requirements
- First LiDAR inventory to pass ARB field verification
- Reduced inventory cost 40% compared to conventional sampling
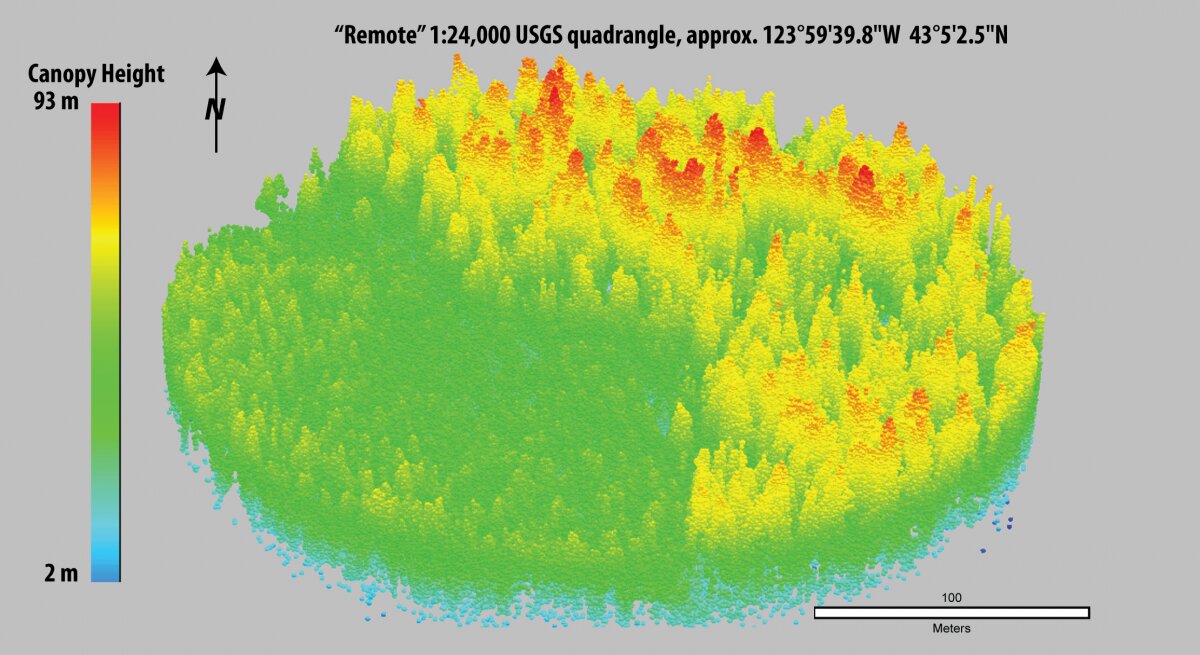
Temperate Rainforest Biomass Mapping
Pacific Northwest old-growth inventory:
- Individual tree detection in structurally complex forests
- Integration with multispectral imagery for species classification
- Biomass estimates for carbon offset baseline
- Monitoring protocol for permanence verification
Tropical Forest REDD+ Project
Amazon basin avoided deforestation initiative:
- Stratified sampling across degradation gradients
- LiDAR transects calibrated with field plots
- Systematic monitoring for leakage detection
- Integration with radar for cloud-free change detection
Emerging Technologies
Spaceborne LiDAR
Satellite platforms providing global coverage:
- GEDI (Global Ecosystem Dynamics Investigation): Waveform sampling for biomass
- ICESat-2 (Ice, Cloud, and land Elevation Satellite): Photon-counting altimetry
- Applications: Large-area baseline mapping, change detection, model calibration
- Limitations: Sparse sampling (25-60m footprints), not wall-to-wall
UAV LiDAR
Drone-based systems:
- Advantages: Low cost, high flexibility, ultra-high point density
- Applications: Small-area intensive inventory, validation, change detection
- Limitations: Limited coverage, regulatory restrictions, processing complexity
Multispectral LiDAR
Sensors with multiple wavelengths:
- Capability: Species discrimination, moisture content, leaf chemistry
- Status: Operational systems emerging (green + near-infrared)
- Potential: Improved biomass models, health monitoring, fire risk
Integration with Optical/Radar
Multi-sensor approaches:
- LiDAR + Hyperspectral: Structure and spectral properties
- LiDAR + SAR: All-weather monitoring, penetration differences
- LiDAR + Multispectral: Cost-effective species mapping
- Fusion methods: Machine learning combining complementary data
Best Practices
Data Acquisition
Specifications for forest inventory:
- Minimum 8 points/m² pulse density
- ±15° maximum scan angle
- Calibrated intensity values
- IMU/GPS quality indicators documented
- Multiple returns recorded
Processing
Standard procedures:
- Consistent ground classification algorithms
- Height normalization verified against survey data
- Systematic outlier detection and removal
- Metric extraction using established libraries (FUSION, LAStools, lidR)
- Documentation of all processing steps
Modeling
Statistical rigor:
- Independent validation dataset (30% of plots)
- Cross-validation for small sample sizes
- Residual analysis for model assumptions
- Sensitivity analysis for parameter uncertainty
- Conservative estimates for carbon accounting
Reporting
Transparency requirements:
- Methodology documentation
- Accuracy assessment with statistical metrics
- Uncertainty quantification
- Quality control procedures
- Data availability and archiving
LiDAR-based forest inventory has matured into a reliable, cost-effective approach for large-area biomass assessment. Proper implementation following established methodologies ensures accurate results meeting regulatory standards for carbon offset verification and sustainable forest management.
Need support with LiDAR-based forest inventory? Contact Arbos to discuss project-specific methodology development and implementation.